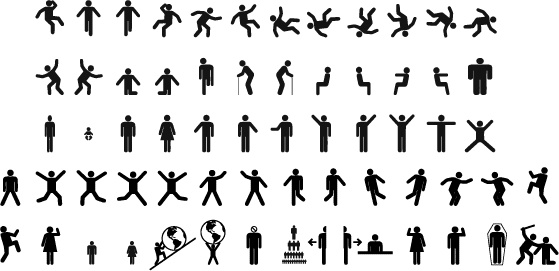
IRAN ART EXHIBITION: HOW PICTOGRAMS HELP CHILDREN TO LEARN THINGS Pictogram definition: a bar, chart, or graph that uses images to represent a collection of data. Includes teaching resources to help teachers save time. What is a Pictogram? Definition A pictogram (also known as a pictograph or picto) is a chart or graph which uses […]
HOW A PICTOGRAPH CAN BE HELPFUL IN EVERY SUBJECT
IRAN ART EXHIBITION: HOW A PICTOGRAPH CAN BE HELPFUL IN EVERY SUBJECT In Statistics, pictographs are charts that are used to represent data using icons and images relevant to the data. A key is often included in a pictograph that indicates what each icon or image represents. All icons in the pictogram must be of […]
MAKE YOUR DATA MORE MEMORABLE WITH DESIGNING PICTOGRAMS
IRAN ART EXHIBITION: MAKE YOUR DATA MORE MEMORABLE WITH DESIGNING PICTOGRAMS A pictogram is one of the simplest and most popular forms of data visualization out there. Besides making your data look nice, pictograms can make your data more memorable. Visually stacking icons to represent simple data can improve a reader’s recall of that data […]